Nitrogen dioxide (NO2)
Updated 27 June 2025

© Crown copyright 2025
This publication is licensed under the terms of the Open Government Licence v3.0 except where otherwise stated. To view this licence, visit nationalarchives.gov.uk/doc/open-government-licence/version/3 or write to the Information Policy Team, The National Archives, Kew, London TW9 4DU, or email: psi@nationalarchives.gov.uk.
Where we have identified any third party copyright information you will need to obtain permission from the copyright holders concerned.
This publication is available at https://www.gov.uk/government/statistics/air-quality-statistics/ntrogen-dioxide
Accredited Official Statistics
Air quality statistics in the UK, 1987 to 2024 - Nitrogen dioxide (NO2)
Updated 26th April 2025
1. Why measure NO2?
Nitrogen dioxide (NO2) is a gas that is mainly produced during the combustion of fossil fuels, along with nitric oxide (NO). NO2 can also be formed when NO reacts with certain gases in the atmosphere. These reactions take place very quickly and are reversible, so the two gases are referred to together as nitrogen oxides (NOx).
Short-term exposure to concentrations of NO2 can cause inflammation of the airways and increase susceptibility to respiratory infections and to allergens. NO2 can exacerbate the symptoms of those already suffering from lung or heart conditions. NO2 can also cause changes to the environment. Deposition of nitrogen to the environment both directly as a gas (dry deposition) and in precipitation (wet deposition) can change soil chemistry and affect biodiversity in sensitive habitats.
In addition, NOx are precursors for the formation of ozone. Ozone is a gas which is also damaging to human health and can trigger inflammation of the respiratory tract, eyes, nose and throat as well as asthma attacks. Moreover, ozone can have adverse effects on the environment through oxidative damage to vegetation including crops.
The Air Quality Standards Regulations (2010) require that the annual mean concentration of NO2 must not exceed 40 µg/m3 and that there should be no more than 18 exceedances of the hourly mean limit value (concentrations above 200 µg/m3) in a single year. The annual compliance assessment, released in September covering the previous calendar year, provides detail on compliance across the UK at a zone level.
2. Trends in concentrations of NO2 in the UK
2.1 Annual mean concentrations of NO2 in the UK, 1990 to 2024
The NO2 index shows the annual mean, averaged over all included sites that had annual data capture greater than or equal to 75 per cent. The shaded areas represent the 95 per cent confidence interval for the annual mean concentration for roadside sites, urban background sites and rural background sites. The intervals narrow over time because of an increase in the number of monitoring sites and a reduction in the variation between annual means at monitoring sites for NO2. Annual means for individual sites can be found in the NO2 statistical tables which accompany this release.
Figure 1: Annual mean concentrations of NO2 in the UK, 1990 to 2024

Download the data for this chart in CSV format
Urban background NO2 pollution has reduced both in the long-term and in recent years. The annual mean concentration of NO2 at urban background sites has decreased over the time it has been monitored to 13.1 µg/m3 in 2024, the lowest point in the time series. This is a decrease of 8 per cent since 2023.
Between 1992 and 2002 inclusive, the annual mean NO2 concentration at urban background sites rapidly decreased by an average of 2.7 µg/m3 each year. This reduction was observed at most monitoring sites across the UK and could be a consequence of the large reduction in emissions of nitrogen oxides over this time period in the UK and in Europe.
Between 2002 and 2006 the annual mean concentration fluctuated with no clear trend, and this was observed at most monitoring sites across the UK. Emissions of nitrogen oxides in the UK and Europe were still decreasing over this period, but these years also coincided with increased use of coal in power stations, and with the increasing popularity of diesel cars (which emit more nitrogen oxide than petrol equivalents).
Between 2006 and 2019 inclusive, the annual mean NO2 concentration at urban background sites decreased by an average of 0.9 µg/m3 each year. Reductions in concentrations were observed at most monitoring sites across the UK. Emissions of nitrogen oxides in the UK and Europe have continued to decrease as newer road vehicles subject to stricter emission standards enter the fleet and power generation moves away from the use of coal.
In 2020, the annual mean NO2 concentration at urban background sites decreased by 4.5 µg/m3 (a decrease of 23 per cent) compared to 2019. It is likely that a reduction in traffic, as a result of COVID-19 restrictions, was a contributing factor to this relatively large decrease. In 2021, concentrations showed a small increase of 5 per cent as traffic increased again from the 2020 low point. However, since then concentrations have resumed the previous reducing trend to 2024.
Roadside NO2 pollution has reduced in the long-term and in recent years, having been stable for most of the 2000s. The annual mean concentration of NO2 at the roadside has decreased over the time series to 20.7 µg/m3 in 2024, the lowest recorded. The annual mean NO2 concentration in 2024 is greater at roadside sites compared to urban background sites. This is most likely due to substantial emissions of nitrogen oxides from road transport sources, as the majority of concentrations at the roadside come from local transport sources.
For most of the 2000s, the rate of decrease in the annual mean NO2 concentration plateaued, likely a result of the increased ownership of diesel-fueled vehicles which historically emitted far more nitrogen oxides compared to equivalent petrol-fueled vehicles. This may have offset the impact of reduced emissions from other sources.
Between 2006 and 2019 inclusive, the annual mean NO2 concentration at roadside sites decreased by an average of 1.8 µg/m3 each year. This reduction was observed at most long-running monitoring sites across the UK and could be a consequence of the large reduction in road transport emissions of NO2 over the same period in the UK, as newer vehicles subject to stricter emissions standards entered the transport fleet.
In 2020, the annual mean NO2 concentration at the roadside decreased by 8.2 µg/m3 (a decrease of 26 per cent). It is likely that a reduction in traffic as a result of COVID-19 restrictions was a contributing factor to this relatively large decrease.
In 2021, the annual mean NO2 concentration at the roadside increased by 1.8 µg/m3, an increase of 8 per cent from 2020. Subsequently concentrations resumed the decreasing trend and in 2024 showed a decrease of 34 per cent compared to 2019 levels.
Rural background NO2 pollution has reduced at a gradual rate over time and is at low concentrations generally. The annual mean concentration of NO2 at rural background sites has shown a decrease of 74 per cent from 1997, to 4.7 µg/m3 in 2024. Since the start of the time series in 1997, the annual mean NO2 concentration at rural background sites has decreased by an average of 0.5 µg/m3 (or 3 per cent) each year. This reduction was observed at most monitoring sites across the UK; which could be a consequence of the large reduction in emissions of nitrogen oxides over the same period in the UK and in Europe. Annual mean concentrations of NO2 in rural areas is generally considerably lower than in urban areas and roadside sites due to generally being further from large sources of NO2 emissions, particularly fossil fuel combustion.
3. Average hours spent in ‘Moderate’ or higher NO2 pollution
This metric measures the annual trend in the number of hours on average that concentrations are recorded at levels that may have impacts on human health. For NO2, ‘Moderate’ air pollution (which requires action by citizens who are vulnerable to the health impacts of air pollution) is triggered when the latest hourly mean concentration is greater than 200 µg/m3. Urban background sites rarely record concentrations at these levels so we have not included a graph for this and NO2 pollution was low at all urban background sites throughout 2024. The coloured categories relate to the categories of the Daily Air Quality Index (see Daily Air Quality Index Table in the statistical tables that accompany this release).
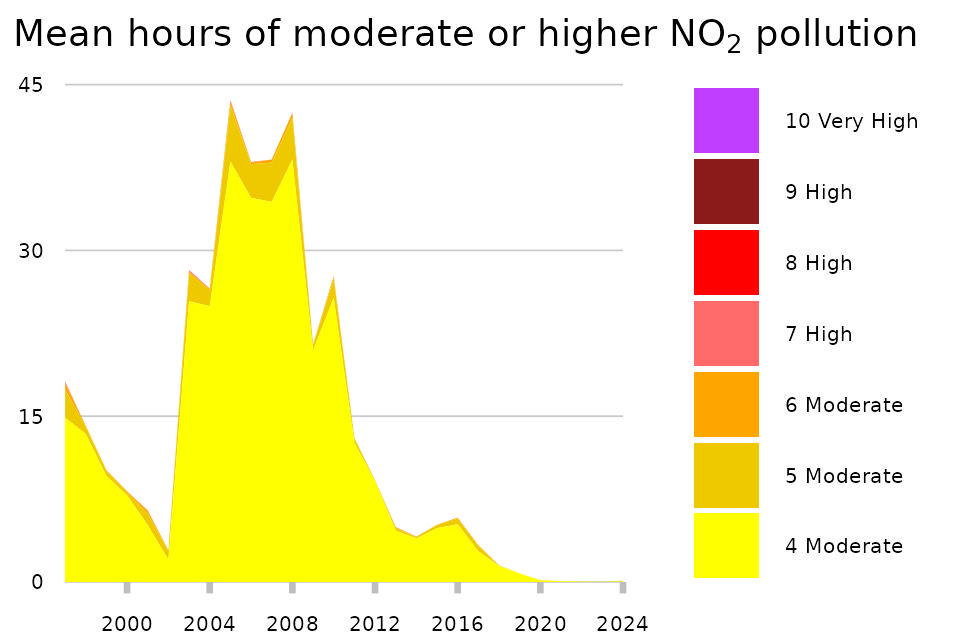
Figure 2: Mean hours when NO2 pollution was moderate or higher for roadside sites, 1997 to 2024
Download the data for this chart in CSV format
Roadside monitoring sites have recorded a decreasing trend in hours of ‘Moderate’ air pollution due to NO2 since 2008. At roadside sites between 2023 and 2024 there was no change in the mean number of hours for which the mean NO2 concentration over the previous hour exceeded 200 µg/m3 at 0.2 hours per site, and they remain at a relatively low level compared to pre-2020.
For PM10 and PM2.5, ‘Moderate’ and higher air pollution has historically been experienced at many monitoring sites across the UK, but for NO2 ‘Moderate’ air pollution has been experienced by only a few particular sites. The overall trend follows the same trend as the London Marylebone Road site which recorded a peak of 853 hours in the ‘Moderate’ or higher categories in 2005 and has recorded at most 1 hours in this category in each year since 2019.
‘Moderate’ NO2 pollution at the roadside is usually the consequence of a build-up of emissions of nitrogen oxides from transport sources, and the presence of street canyons or wind conditions preventing dispersion of pollutants. For example, the London Marylebone Road site is on a six-lane congested road surrounded by high-rise buildings in central London.
4. Temporal variations in concentrations of NO2 in the UK, 2024
4.1 Weekday variations
The NO2 index shows the weekday mean, averaged over all included sites that had data capture greater than or equal to 75 per cent for all instances of that weekday in a given year. The shaded areas represent the 95 per cent confidence interval for the weekday mean concentration for roadside sites, urban background sites and rural background sites.
Figure 3: Weekday mean NO2 concentration at roadside, urban background and rural background sites, 2024

Download the data for this chart in CSV format
NO2 concentrations tend to be lower at the weekend compared to during weekdays, particularly for roadside sites. This is likely to be primarily driven by less road traffic at the weekends. In 2024, the Monday-to-Friday mean concentration at roadside sites was 21.8 µg/m3, which was 23 per cent greater than the mean concentration at the weekend of 17.7 µg/m3.
4.2 Hourly variations
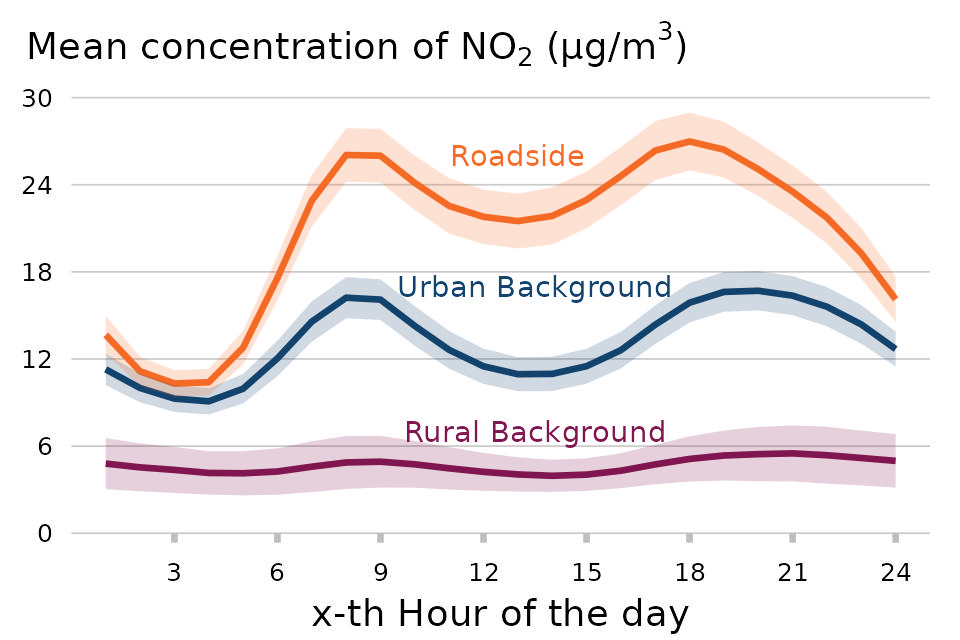
The NO2 index shows the hourly mean, averaged over all included sites that had data capture greater than or equal to 75 per cent for all instances of that hour in a given year. The shaded areas represent the 95 per cent confidence interval for the hourly mean concentration for roadside sites, urban background sites and rural background sites.
Figure 4: Hourly mean NO2 concentration at roadside, urban background and rural background sites, 2024
Download the data for this chart in CSV format
NO2 concentrations tend to be much greater during the morning and evening compared to other times of the day, particularly at roadside and urban background locations. This is most likely due to commuter traffic. This pattern of concentrations follows the distribution of road traffic by time of day, see Road traffic estimates in Great Britain, 2024.
5. Sections in this release
Background to concentrations of air pollutants
Concentrations of particulate matter (PM10 and PM2.5)
Days with ‘Moderate’ or higher air pollution (includes sulphur dioxide)