Ozone (O3)
Updated 27 June 2025

© Crown copyright 2025
This publication is licensed under the terms of the Open Government Licence v3.0 except where otherwise stated. To view this licence, visit nationalarchives.gov.uk/doc/open-government-licence/version/3 or write to the Information Policy Team, The National Archives, Kew, London TW9 4DU, or email: psi@nationalarchives.gov.uk.
Where we have identified any third party copyright information you will need to obtain permission from the copyright holders concerned.
This publication is available at https://www.gov.uk/government/statistics/air-quality-statistics/concentrations-of-ozone
Accredited Official Statistics
Air quality statistics in the UK, 1987 to 2024 - Ozone (O3)
Updated 26th June 2025
1. Why measure O3?
Ozone (O3) is a gas which is damaging to human health and can trigger inflammation of the respiratory tract, eyes, nose and throat as well as asthma attacks. In addition, ozone can have adverse effects on the environment through oxidative damage to vegetation including crops (see this report for further information on the latest assessment of ozone impacts on vegetation and habitats). As an oxidant, ozone also reacts with other chemicals in the air to form smog. Therefore, it is important to measure ozone concentrations to identify whether they pose risks to public health and the environment.
In contrast to many air pollutants measured in the UK, there are no major emission sources of ozone. It is a secondary pollutant that is formed in the air from chemical processes involving other pollutants known as precursors. Ozone precursors are volatile organic compounds (including methane) and nitrogen oxides, these go through a series of reactions in the presence of sunlight to produce ozone at ground-level .
The complexity of the reactions producing ozone, their reliance on sunlight, and the interdependence between ozone and various precursor pollutants means that assessing and tackling exposure to ozone and its precursor pollutants is difficult. For example, when sunlight levels are low, nitric oxide (NO), which is an ozone precursor, can contribute to the removal of ozone from the atmosphere, known as a titration effect. Indeed, studies have shown that, as NOx concentrations decrease in urban areas, there may be an associated increase in ozone concentrations. Another layer of complexity in assessing exposure to ozone is that once formed, ozone can persist in the air for several days and thus can travel long distances (e.g. between mainland Europe and the UK), so contributing to elevated concentrations far from where it was formed. This complexity means that ozone concentration measurements are vital for the effective assessment of ozone pollution in the UK, and of any unintended consequences from NOx reductions. It does not suffice to estimate emissions or merely rely on measurements of ozone precursor pollutants to assess potential exposure to ozone and its impact in the UK.
The Air Quality Standards Regulations (2010) set the human health target for ozone at a maximum daily eight hour mean concentration of 120 µg/m3. This target value is not to be exceeded on more than 25 days per calendar year averaged over three years. There is also a target level set for the protection of vegetation, which is assessed using the AOT40 - a metric which sums up how much ozone exceeds 80 µg/m3 during daylight hours from May to July in a given year; the target is set as a five-year average of these annual cumulative values. The annual compliance assessment, released in September covering the previous calendar year, provides detail on compliance across the UK at a zone level.
2. Trends in concentrations of O3 in the UK
2.1 Annual mean concentrations of O3 in the UK, 1987 to 2024
The O3 index shows the annual mean of the daily maximum 8-hour mean, averaged over all sites that had annual data capture greater than or equal to 75 per cent. The shaded areas represent the 95 per cent confidence interval for the annual mean concentration for urban background sites and rural background sites. Annual means for individual sites can be found in the O3 statistical tables which accompany this report.
Figure 13: Annual mean concentrations of O3 in the UK, 1987 to 2024

Notes:
- This graph shows the annual mean of the daily maximum 8-hour mean concentration of ozone.
Download the data for this chart in CSV format
Urban background O3 pollution has shown a long-term increase.
The annual average daily maximum eight hour mean concentration of ozone at urban background sites has shown an increasing trend since 1992. In 2024, the annual average daily maximum eight hour mean concentration of ozone was 66.1 µg/m3, slightly down from the highest level on record in 2023 (66.9 µg/m3).
Ozone concentrations can vary substantially between years because of year-to-year variability in meteorology. Some variation from year-to-year is driven by fluctuations in the occurrence of hot summer weather conditions which are associated with high ozone concentrations.
The increase in urban background ozone concentrations over this prolonged period, despite reductions in the emission of ozone precursors, is likely due to multiple factors such as the transport of ozone from more polluted areas.
Concentrations fluctuated from the mid-2000s to 2016 with no obvious trend.
Since 2017, urban background ozone concentrations have followed an upward trend, with 2023 being highest in the time series.
The Met Office report the five warmest years in the UK since 1884 to include 2020, 2022 and 2023. The warm weather experienced in such years would possibly have led to more ozone formation than usual.
Rural background O3 pollution has been higher in recent years.
The average daily maximum eight hour mean concentration has fluctuated since the start of the time series in 1987 and was 71.1 µg/m3 in 2024, slightly lower than the highest levels on record in 2022 (73.9 µg/m3); there was a decrease of 3 per cent in concentrations from 2023 to 2024.
Rural background ozone concentrations have gradually increased over the past few decades, though it does vary year-to-year. This variation is expected due to fluctuations in the occurrence of hot summer weather conditions which are associated with high ozone concentrations. The future trend in concentrations will be dependent on global emissions of ozone precursors.
Comparing urban and rural concentrations of ozone.
Ozone is formed through a complex chemical reaction involving nitrogen oxides (NOx) and volatile organic compounds (VOCs) in the presence of sunlight. Ozone concentrations, counterintuitively, are typically higher in rural areas than in urban areas. Some of this difference is explained by lower concentrations of pollutants (for example nitric oxide (NO) in rural environments, which can degrade ozone or inhibit its formation, in contrast to urban areas which tend to have higher concentrations of these pollutants due to traffic, industrial activities and other sources. Overall, air pollutant concentrations in urban areas are on a long-term declining trend, which may lead to less suppression of ozone concentrations. This could partly explain why ozone concentrations in urban areas have increased at a greater rate than in rural areas, and why the difference between urban and rural concentrations has narrowed over time.
3. Average hours spent in ‘Moderate’ or higher O3 pollution
This metric measures the annual trend in the number of hours on average that concentrations are recorded at levels that may have impacts on human health. For O3, ‘Moderate’ air pollution (which requires action by citizens who are vulnerable to the health impacts of air pollution) is triggered when the latest 8-hour running mean concentration is greater than 100 µg/m3. The coloured categories in Figures 14 and 15 correspond to the Daily Air Quality Index (see Daily Air Quality Index Table in the statistical tables that accompany this release).
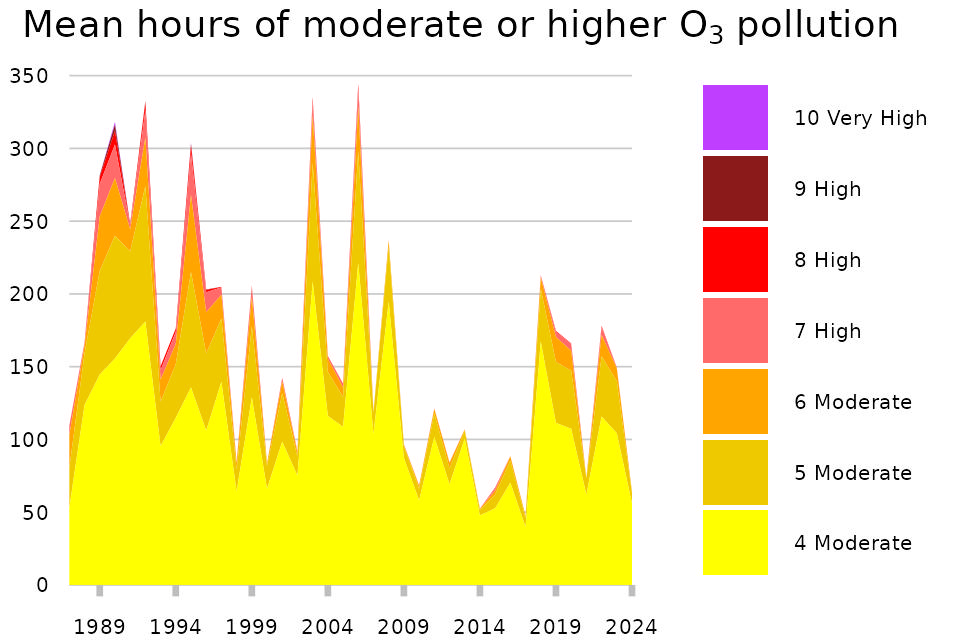
Figure 14: Mean hours when O3 pollution was ‘Moderate’ or higher for rural background sites, 1987 to 2024
Download the data for this chart in CSV format
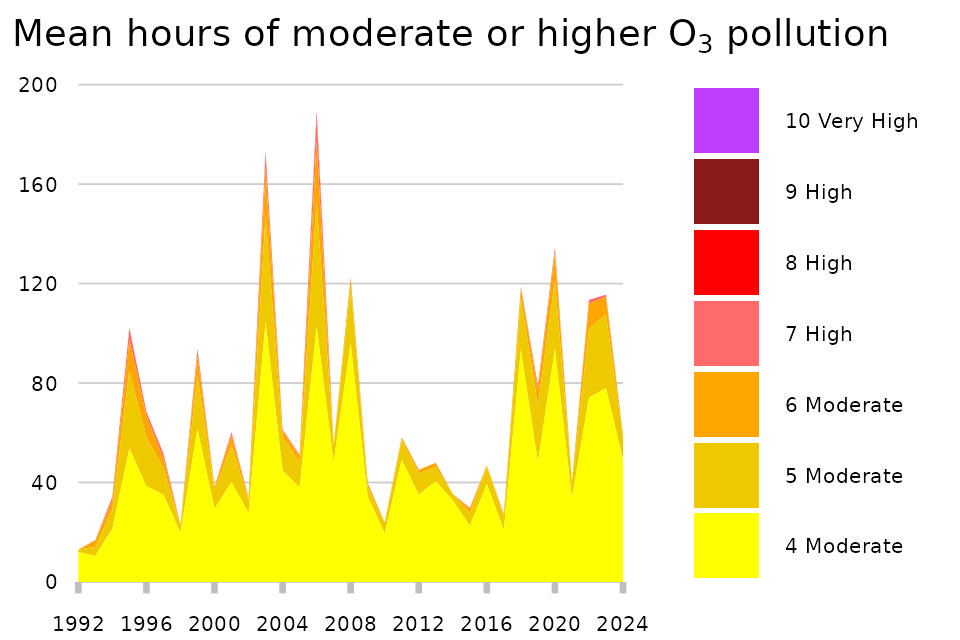
Figure 15: Mean hours when O3 pollution was ‘Moderate’ or higher for urban background sites, 1992 to 2024
Download the data for this chart in CSV format
Since 2018, urban and rural background monitoring sites recorded an increased number of hours of ‘Moderate’ or higher O3 air pollution, after a decade of a relatively low number of hours.
At urban background sites between 2017 and 2020 there was a large increase in the number of hours for which the mean O3 concentration over the previous 8 hours exceeded 100 µg/m3 to 134 hours in 2020, the highest value in over a decade. Overall, the recent time series remains volatile, with a considerably lower mean number of hours in 2021 (40 hours) followed by relatively high levels in 2022 and 2023, followed by a fall to 59 hours in 2024.
There was a similar rise in rural background concentrations between 2017 and 2019. Since then the number of hours of ‘Moderate’ or higher O3 pollution have fluctuated with notable dips in 2021 (74 hours) and 2024 (64 hours).
The overall trend in the rural indicator is a long-term decrease interrupted by several years where moderate pollution was more common. The long-term decrease is likely in part driven by reductions in global emissions of substances that lead to the formation of ozone, such as nitrogen oxides and volatile organic compounds, as well as changes in weather patterns.
The overall trend in the urban indicator is less clear. Ozone concentrations are strongly influenced by weather, which likely contributes to the high variability over time and peaks such as in the hot, sunny summers of 2003, 2006, 2018, 2019, 2020, 2022 and 2023. This means that long time series are required to distinguish between weather effects and the effect of changes in pollutant emissions. In 2020, reductions in NOx concentrations in urban environments as a result of COVID-19 restrictions were probably also a large contributing factor to increased ozone pollution, since less NO will have been available to react with ozone and inhibit its formation.
4. Temporal variations in concentrations of O3 in the UK, 2024
4.1 Monthly variations
The O3 index shows the monthly mean, averaged over all included sites that had monthly data capture greater than or equal to 75 per cent in a given year. The shaded areas represent the 95 per cent confidence interval for the monthly mean concentration for and urban background sites and rural background sites.
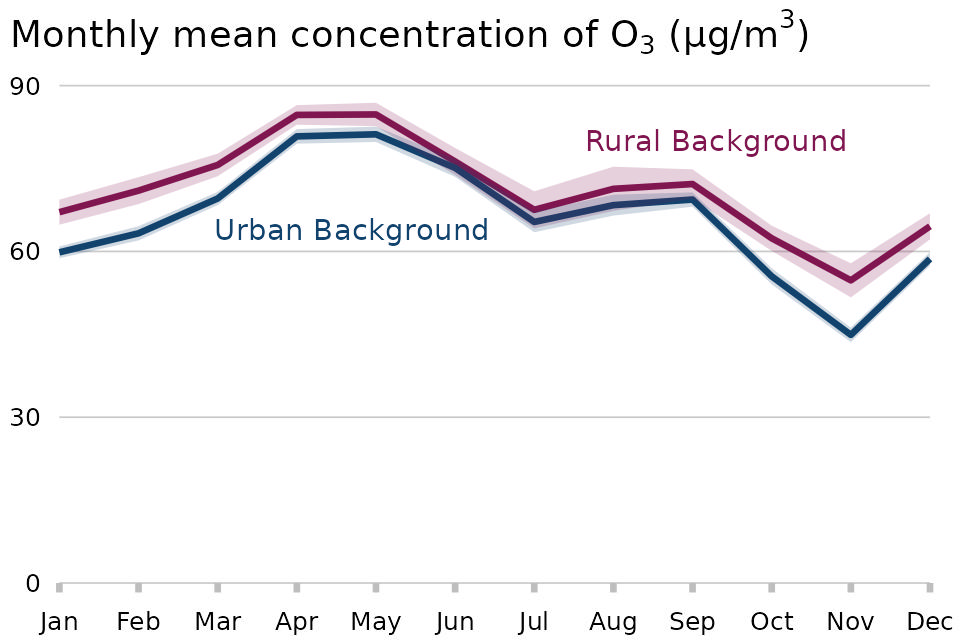
Figure 16: Monthly mean daily maximum 8-hour mean concentrations of O3 in the UK, 2024
Download the data for this chart in CSV format
For O3 the greatest average concentrations tend to occur during the spring and summer months. Ozone is a secondary pollutant, meaning it is created in the atmosphere through a cycle of reactions of its precursors nitrogen oxides and volatile organic compounds (VOC). Sunlight is also a key part of the ozone production cycle. In the summer stagnant air leads to the build-up of these precursor compounds, while more sunlight and higher temperatures increase the rates of reactions that generate ozone.
In 2024, the month that had the greatest ozone concentrations was May for both rural and urban monitoring sites (with monthly mean concentrations of 84.8 µg/m3 and 81.2 µg/m3 respectively). May 2024 was the warmest on record which contributed to the hottest Spring overall on record, see Met Office blog. This warm spell would likely have increased the rate of chemical reactions between the precursor pollutants that form ozone.
Ozone exhibits strong seasonal and diurnal cycles. Monthly average ozone concentrations in the UK are usually at their maximum in April and May, in contrast to most of continental Europe where monthly ozone tends to have a maximum in June and July. At urban sites in 2024, the difference between the highest monthly average (81.2 µg/m3 in May) and lowest monthly average (44.9 µg/m3 in November) was 36.3 µg/m3. This difference tends to be higher at urban locations, which likely reflects higher rates of chemical removal of ozone in winter from increased NO emissions in winter, see AQEG report Ozone in the UK.
5. Sections in this release
Background to concentrations of air pollutants
Concentrations of nitrogen dioxide
Concentrations of particulate matter (PM10 and PM2.5)
Days with ‘Moderate’ or higher air pollution (includes sulphur dioxide)